

AdvinServers - New Platform - Ascienth (Alpha) Review
 AnthonySmith
AdministratorProviderOG
AnthonySmith
AdministratorProviderOG 






This is the first review of a host on a LowEndSpirit blog in a long time, and it is hopefully the start of a more regular, permanent feature of LES. This is a bit of a test post; I am not used to making them, and feedback is welcome!
I asked @Advin if it was ok to do this first, and I want to make it very clear that this review is of an Alpha product, and that the panel is NOT yet in production and is by invitation only in the LES Exclusive offers section. Any performance metrics are on a likely very loaded-up test hypervisor used for the development of the panel software and should not be used as a predictor of the overall performance of AdvinServers.
For transparency, AdvinServers have also supported TierHive with some amazing deals in Kansas, allowing us to expand there, and the performance is amazing on their, I assume, soon-to-be legacy platform but production Hypervisors!
That said, I will be writing this from here on from the perspective of just using a regular VPS I have bought, so let's just call this post knocking the rust off and getting used to doing this again!
AdvinServers offers VPS, dedicated servers and Website hosting, it seems their primary location is Kansas and stock is often limited in other locations and they are currently sold out of almost everything except A few options in Kansas and web-hosting victims of their own sucsess we hope!
I got signed up as a tester for Ascienth, first observation, I dont know how to say that  (Ask ee enth)?
Sign-up was simple; it should be noted that it seems KYC will apply when this goes live:
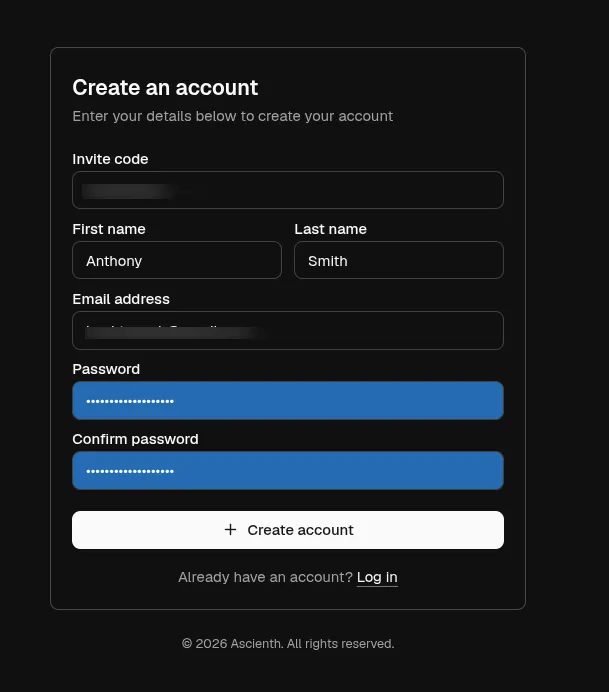
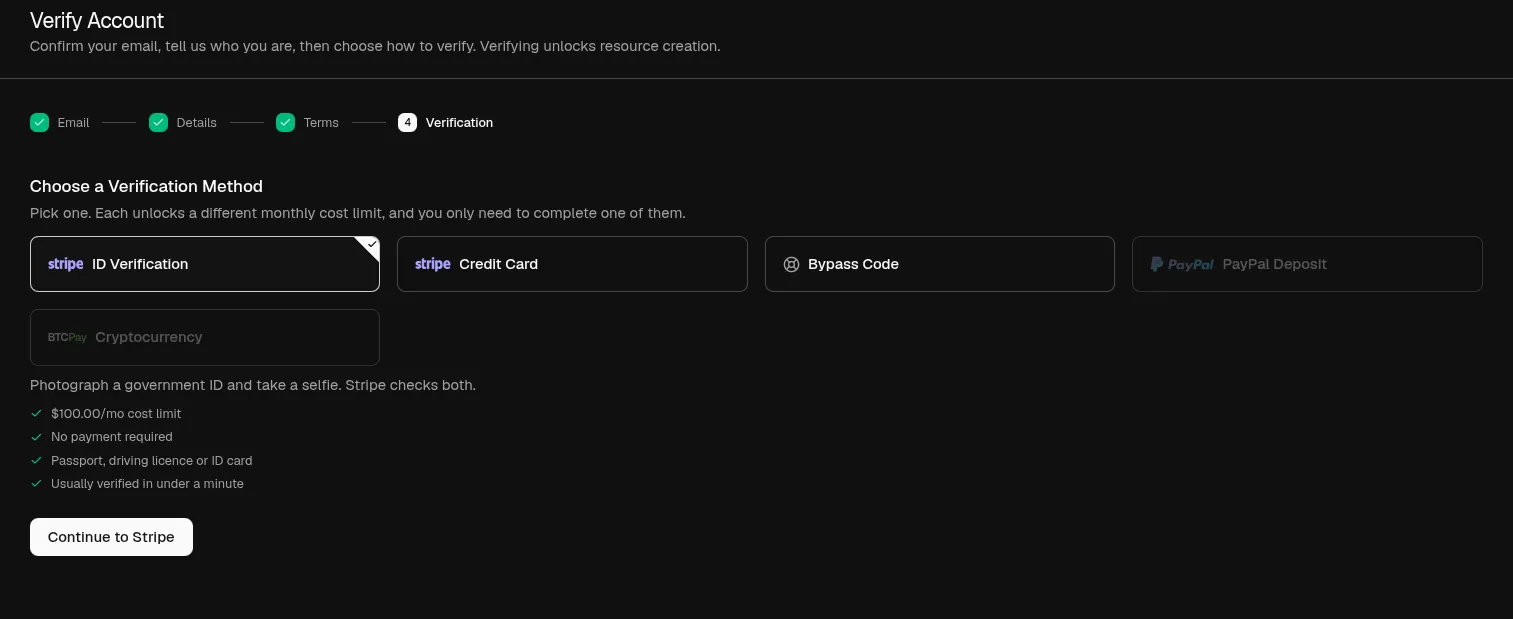
An interesting observation was that they seem to plan to offer a physical paper invoice?

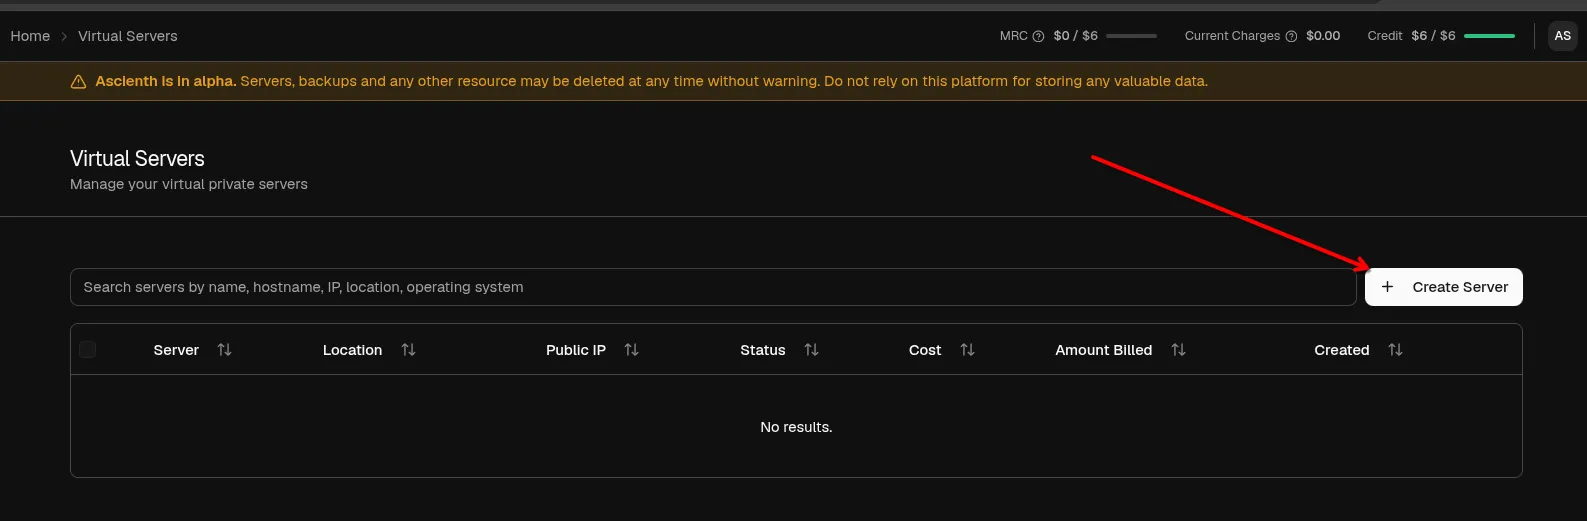
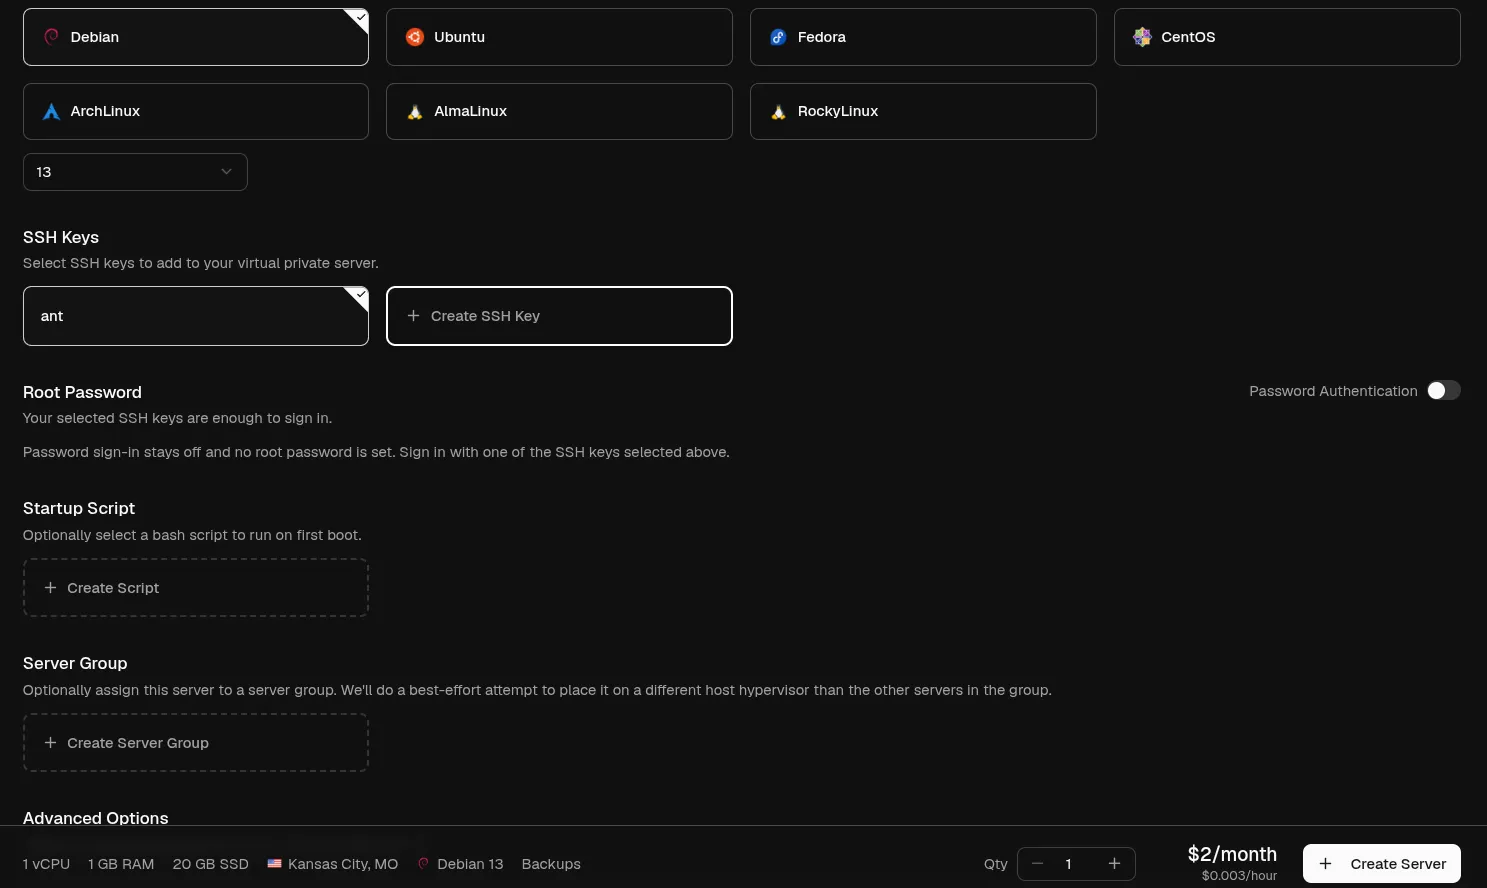
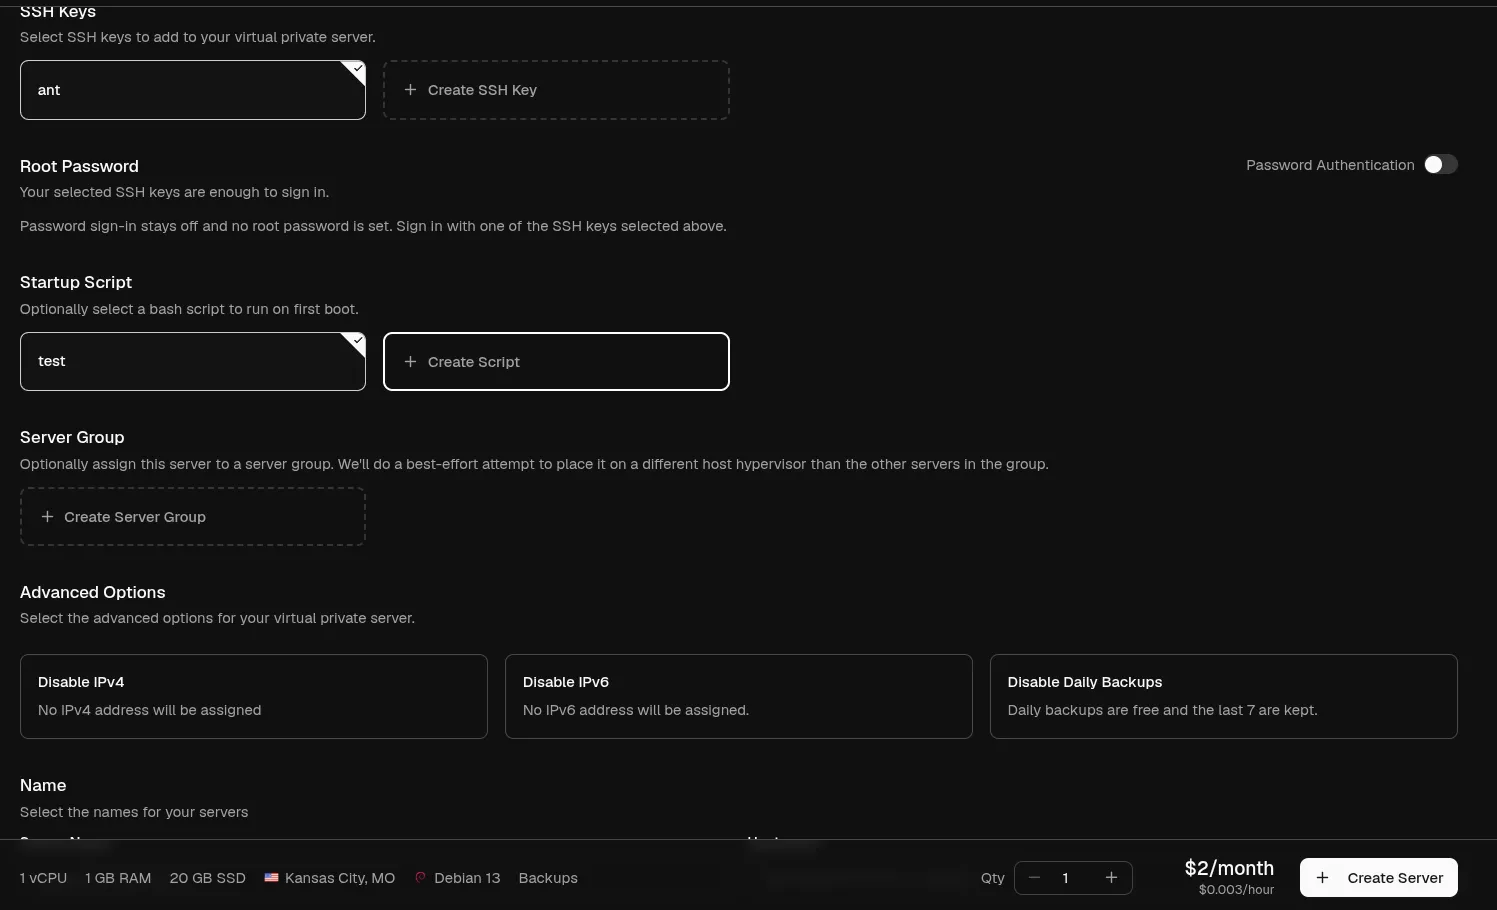
Once you are in, and validated and you hae agreed to the terms etc, you can create a VPS, I went for the Micro plan with 1vCPU, 1 GB Ram and 20 GB Disk priced at $2/month or $0.003 per hour, it is great to see more hourly billing options opening up these days.
You can add/create a key during provisioning, pick an OS, and add a startup script (which I tested)
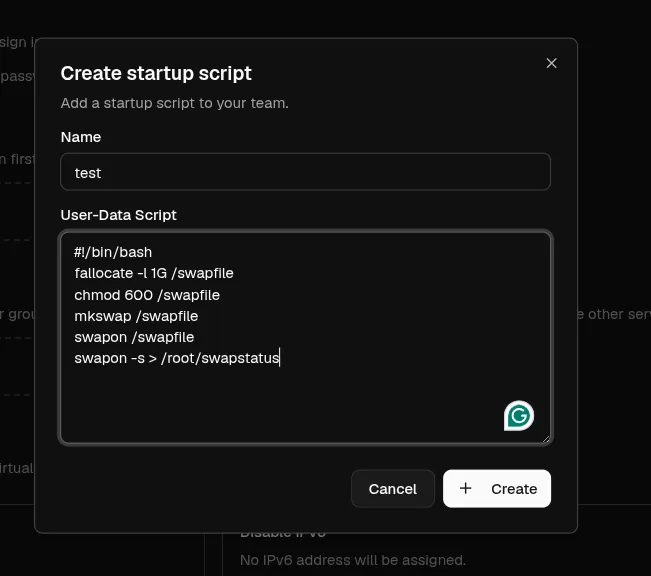
And once the VPS deployed (around 8 seconds later) I could see that the startup script did in fact run:

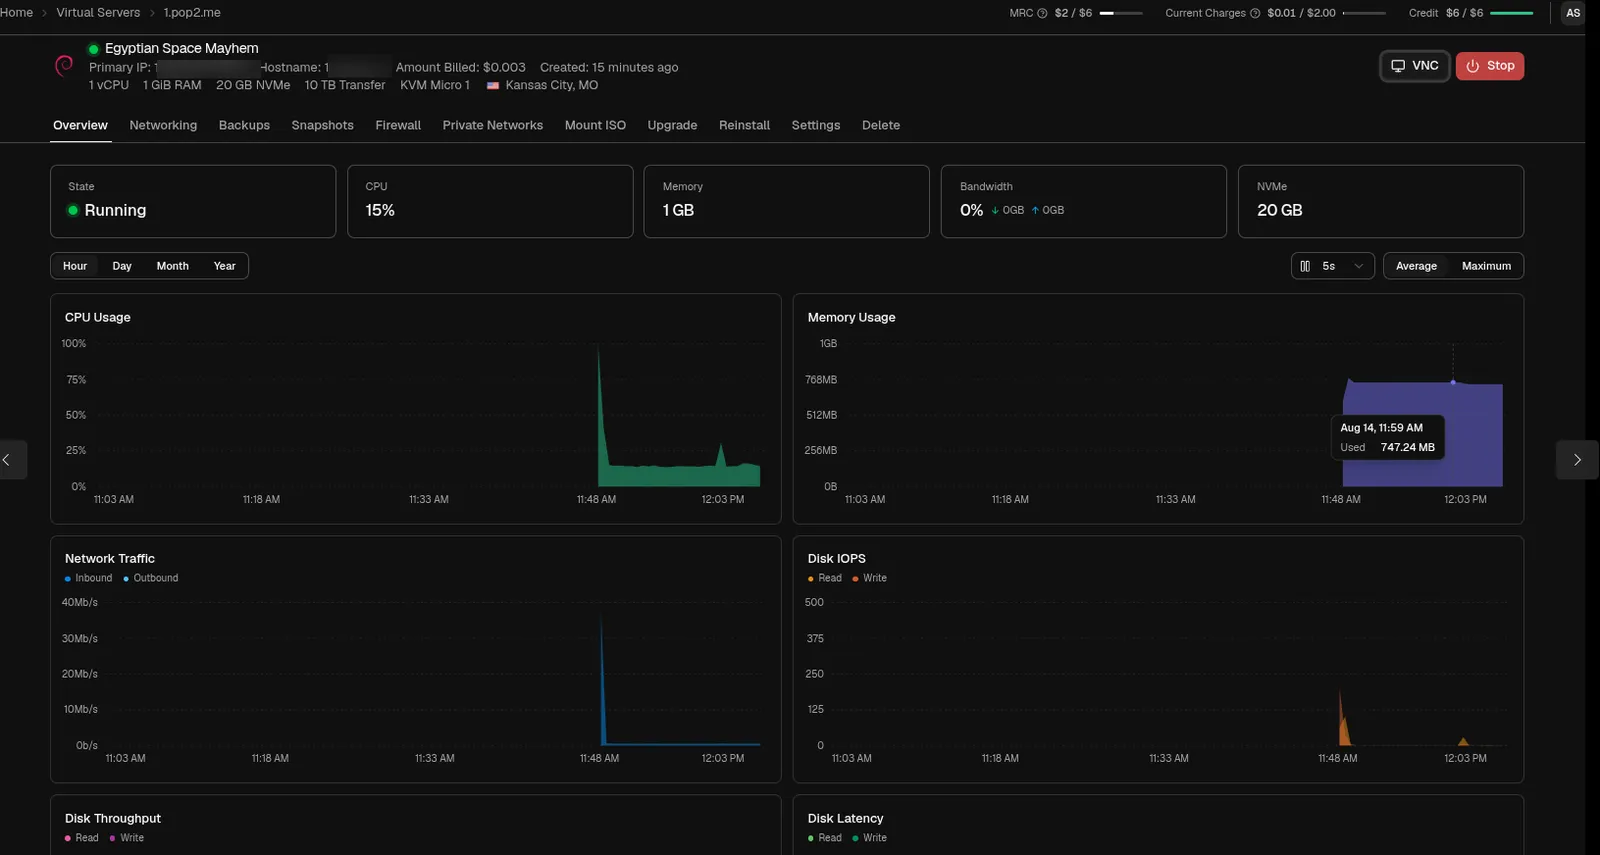
The dashboard is pretty easy to follow for people used to the VPS world I think and it looks really nice, well beyond any other Alpha product I have seen:
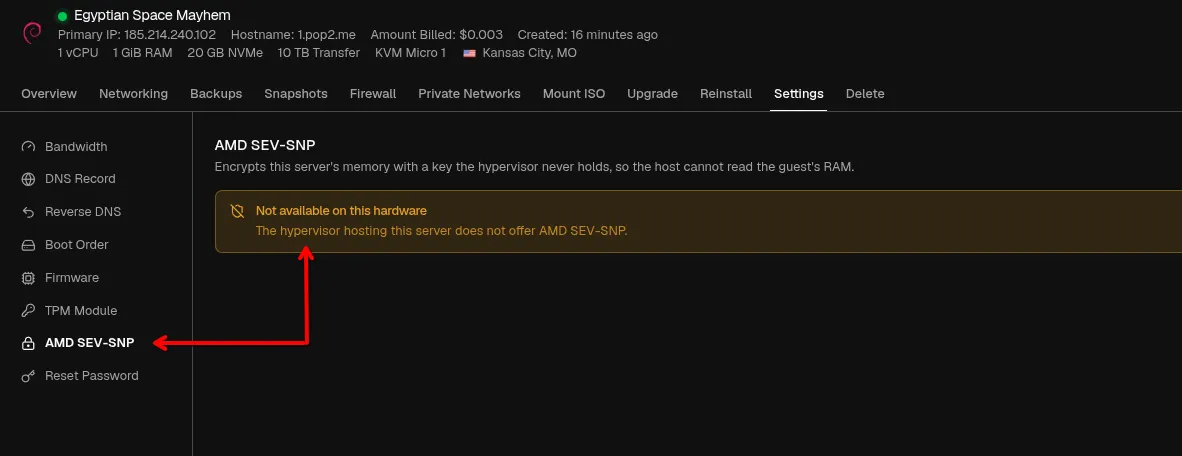
There are also a number of cool features for more advanced users, like being able to switch between biosmode/csm and UEFI without having to ask the host and forcing AMD SEV-SNP to encrypt the guest RAM to prevent it from being read by the hypervisor.
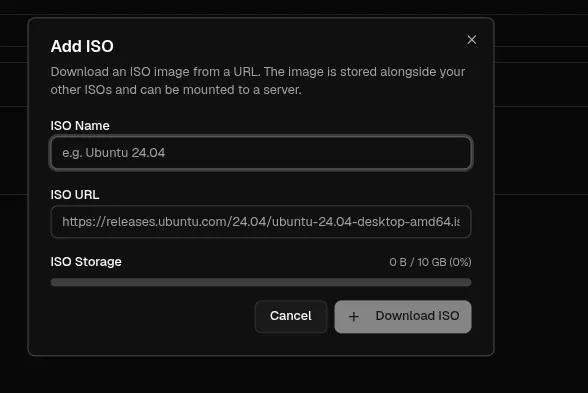
You get 10GB of free ISO storage which is nice for self managed installs if you do not like the templates.
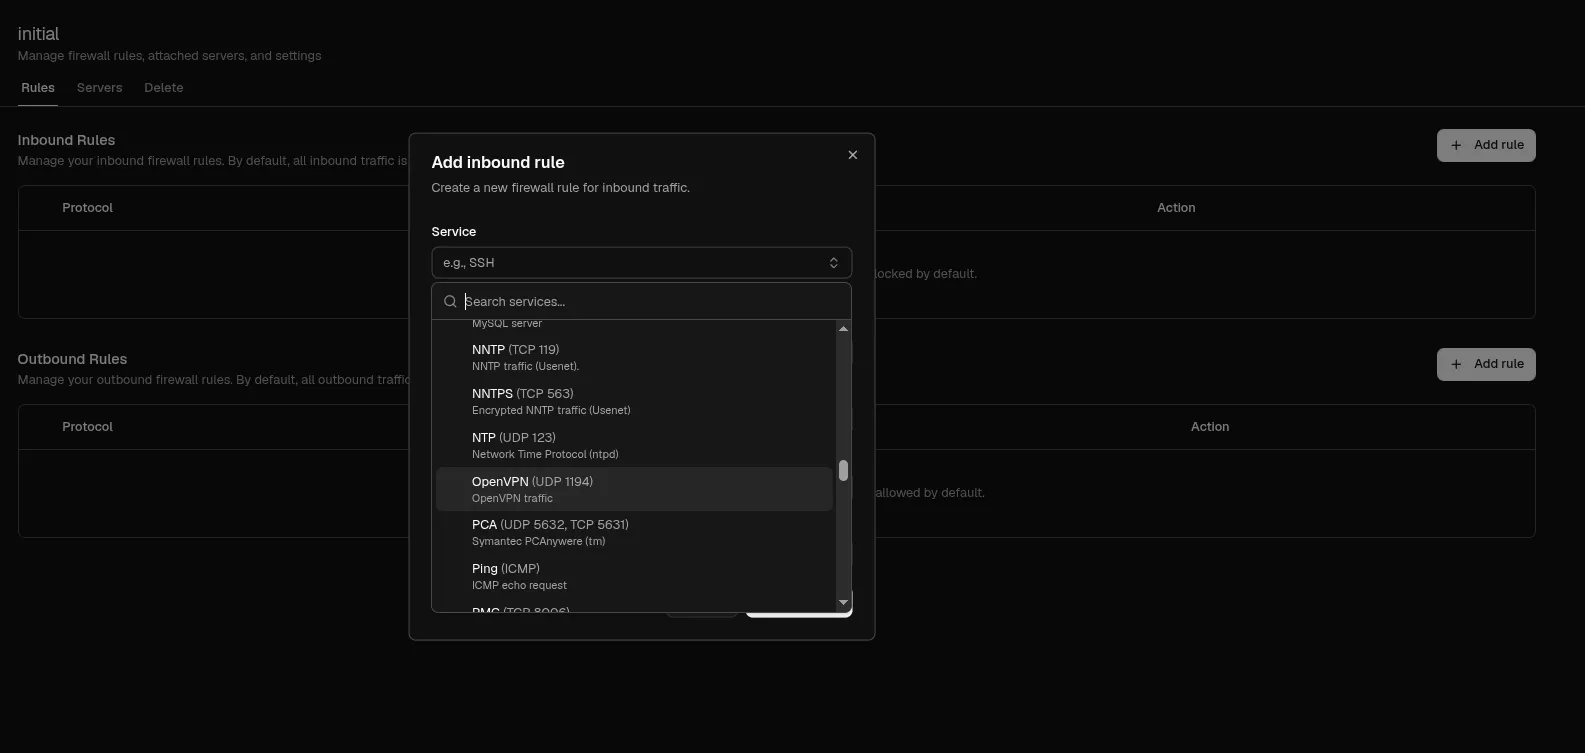
There is also a panel managed firewall which you can apply to multiple servers, this is pretty cool as it already includes a large selection of pre defined rules to pick from:
Benchmarks and technical notes
I am going to skip yabs on this one because, as I said, its an Alpha product, its purpose is not performance. Everyone already knows that its hard to beat AdvinServers node performance in general, this Hypervisor is for development only so I dont want to taint google with bad results, but I will do some basic testing as reference only:
As always picked the latest Debian release available, 13 at the time of writing.
results as follows
dd
root@1:~# dd if=/dev/zero of=test bs=64k count=16k conv=fdatasync
16384+0 records in
16384+0 records out
1073741824 bytes (1.1 GB, 1.0 GiB) copied, 1.31352 s, 817 MB/s
The dd is fast enough, not a great test to run on NVMe-based servers, but just indicative.
ioping
root@1:~# ioping -c 10 .
4 KiB <<< . (ext4 /dev/vda1 19.5 GiB): request=1 time=332.4 us (warmup)
4 KiB <<< . (ext4 /dev/vda1 19.5 GiB): request=2 time=610.4 us
4 KiB <<< . (ext4 /dev/vda1 19.5 GiB): request=3 time=612.1 us
4 KiB <<< . (ext4 /dev/vda1 19.5 GiB): request=4 time=682.6 us
4 KiB <<< . (ext4 /dev/vda1 19.5 GiB): request=5 time=712.5 us
4 KiB <<< . (ext4 /dev/vda1 19.5 GiB): request=6 time=642.9 us
4 KiB <<< . (ext4 /dev/vda1 19.5 GiB): request=7 time=605.0 us
4 KiB <<< . (ext4 /dev/vda1 19.5 GiB): request=8 time=498.6 us
4 KiB <<< . (ext4 /dev/vda1 19.5 GiB): request=9 time=572.7 us
4 KiB <<< . (ext4 /dev/vda1 19.5 GiB): request=10 time=642.1 us

--- . (ext4 /dev/vda1 19.5 GiB) ioping statistics ---
9 requests completed in 5.58 ms, 36 KiB read, 1.61 k iops, 6.30 MiB/s
generated 10 requests in 9.00 s, 40 KiB, 1 iops, 4.44 KiB/s
min/avg/max/mdev = 498.6 us / 619.9 us / 712.5 us / 58.6 us
ioping shows the disk is probably getting hit fairly hard in general (The course of a free test server)
vmstat
root@1:~# vmstat
procs -----------memory---------- ---swap-- -----io---- -system-- -------cpu-------
 r  b   swpd   free   buff  cache   si   so    bi    bo   in   cs us sy id wa st gu
 2  0      0 726352  14624 139004    0    0    29     4  857    4  0  3 96  0  0  0
vmstat shows everything has what it needs, I ran this at various times, any minimal numbers can be disregarded as queue overhead.
cpu
root@1:~# lscpu
Architecture:                x86_64
  CPU op-mode(s):            32-bit, 64-bit
  Address sizes:             48 bits physical, 48 bits virtual
  Byte Order:                Little Endian
CPU(s):                      1
  On-line CPU(s) list:       0
Vendor ID:                   AuthenticAMD
  Model name:                AMD EPYC 7C13 64-Core Processor
    CPU family:              25
    Model:                   1
    Thread(s) per core:      1
    Core(s) per socket:      1
    Socket(s):               1
    Stepping:                1
    BogoMIPS:                3999.99
    Flags:                   fpu vme de pse tsc msr pae mce cx8 apic sep mtrr pge mca cmov pat pse36 clflush mmx fxsr sse sse2 syscall nx mmxext fxsr_opt pdpe1gb rdtscp lm rep_good nopl xtopology cpuid extd_apicid tsc_known_freq pni pcl
                             mulqdq ssse3 fma cx16 pcid sse4_1 sse4_2 x2apic movbe popcnt tsc_deadline_timer aes xsave avx f16c rdrand hypervisor lahf_lm cmp_legacy svm cr8_legacy abm sse4a misalignsse 3dnowprefetch osvw perfctr_core ss
                             bd ibrs ibpb stibp vmmcall fsgsbase tsc_adjust bmi1 avx2 smep bmi2 erms invpcid rdseed adx smap clflushopt clwb sha_ni xsaveopt xsavec xgetbv1 xsaves clzero xsaveerptr wbnoinvd arat npt lbrv nrip_save tsc_sc
                             ale vmcb_clean flushbyasid pausefilter pfthreshold v_vmsave_vmload vgif umip pku ospke vaes vpclmulqdq rdpid overflow_recov succor fsrm arch_capabilities
Virtualization features:
  Virtualization:            AMD-V
  Hypervisor vendor:         KVM
  Virtualization type:       full
Caches (sum of all):
  L1d:                       64 KiB (1 instance)
  L1i:                       64 KiB (1 instance)
  L2:                        512 KiB (1 instance)
  L3:                        16 MiB (1 instance)
NUMA:
  NUMA node(s):              1
  NUMA node0 CPU(s):         0
Vulnerabilities:
  Gather data sampling:      Not affected
  Indirect target selection: Not affected
  Itlb multihit:             Not affected
  L1tf:                      Not affected
  Mds:                       Not affected
  Meltdown:                  Not affected
  Mmio stale data:           Not affected
  Reg file data sampling:    Not affected
  Retbleed:                  Not affected
  Spec rstack overflow:      Mitigation; Safe RET
  Spec store bypass:         Mitigation; Speculative Store Bypass disabled via prctl
  Spectre v1:                Mitigation; usercopy/swapgs barriers and __user pointer sanitization
  Spectre v2:                Mitigation; Retpolines; IBPB conditional; IBRS_FW; STIBP disabled; RSB filling; PBRSB-eIBRS Not affected; BHI Not affected
  Srbds:                     Not affected
  Tsa:                       Vulnerable: Clear CPU buffers attempted, no microcode
  Tsx async abort:           Not affected
  Vmscape:                   Not affected
Basic network and jitter test
root@1:~# mtr -rwc 100 cloudflare.com
Start: 2026-08-14T14:06:04+0000
HOST: 1.pop2.me      Loss%   Snt   Last   Avg  Best  Wrst StDev
  1.|-- 1xx.xxx.xxx.x   0.0%   100    0.5   0.8   0.4   8.3   1.2
  2.|-- 1xxx.xxx.xxx.x    0.0%   100    7.3   0.7   0.4   7.3   1.0
  3.|-- 2xx.xx.xxx.xx    0.0%   100    6.5  10.6   5.6  50.3   8.2
  4.|-- 104.16.133.229  0.0%   100    5.8   6.5   5.7  17.3   1.6
A little bit of apparent ICMP queuing, as expected these days and very low latency to the closest Cloudflare endpoint, which... is amazing!
Ram on initial boot
root@1:~# free -m
               total        used        free      shared  buff/cache   available
Mem:             967         251          67           0         788         716
Swap:              0           0           0
I consider this quite heavy by around 100mb, it seems to be due to cloud-init and the QEMU guest agent and the scsi threads (27 paired with error handlers). This has a lot of processes running, probably something to do with how the template was built or how virtio-scsi is implemented.
Obervations
The active disk scheduler is mq-deadline, not none, which is usually recommended for performance and has TRIM enabled and set to 2G so the disk images are likley thin provisioned (almost always the case these days in the NVMe world, nothing unusual)
The VirtIO Balloon device is present and active so there is likely active reclaim going on, again, fine and dandy its available when needed and not wasted when not, helping performance for everyone.
The VirtIO vsock/guestagent is enabled and present as standard so probably passing usage info back to the panel on demand (the fancy graphs on the overview) and possibly managing password resets and power functions as a primary method.
The panel also has backups, snapshots, account teams, account groups, access control, server groups, private networking, rdns, automated upgrades, a vanity hostname they provide which you can use to ssh in rather than remember the IP, and TPM
Overall, although it has been a while since I used it, the panel reminded me of VirtFusion, I am honestly not sure if VirtFusion has any part to play here or if this is just a result of platform constraints like Laravel, etc or natural inspiration taken from other panels.
Overall, a great experience.
TierHive - Hourly VPS - NAT Native - /24 per customer - DE, UK, SG, CA, USA x4, FR x2, AU, PL, NL, JP
FREE tokens on sign up, try before you buy. | Static Hosting Free for life: https://tierhive.com/static-hosting/