

Server resource monitoring
 MikeA
ProviderOG
MikeA
ProviderOG 
Hi guys, I wanted to share a hosted monitoring/alerting service that I was originally working on. It was originally made to replace some of my own stuff like snmp monitoring and another third party service I was using for common resource alerting/historical data monitoring, and I decided to make a prettier and better version of it that anyone can sign up and use. Foremost, the majority of this was built with AI coding (Kimi V3).
No cost, 15 servers/agents for now.
- View 90 days of historical data for CPU, RAM, storage, iowait, CPU temp, network usage (physical NIC), network traffic (totals), mdadm raid monitoring, reboot monitoring
- Setup and receive alerts if a threshold is hit or server appears offline.
- Receive alerts to Email, Pushover, Discord, Slack, Telegram, Twilio (Calling/SMS), or your own webhook.
- Set global thresholds/limits or per-server
- Add multiple people to have access privileges
- Create multiple separate organizations with their own servers
- REST API (basic for now)
- Supports any Linux with systemd, basic Windows server support. Agent app uses 17~MB memory, pushed statistic data over https/443.
If you try it out and want to remove it from your server, just go to the web interface and click the delete button, it'll give you a command on how to remove it from your server easily.
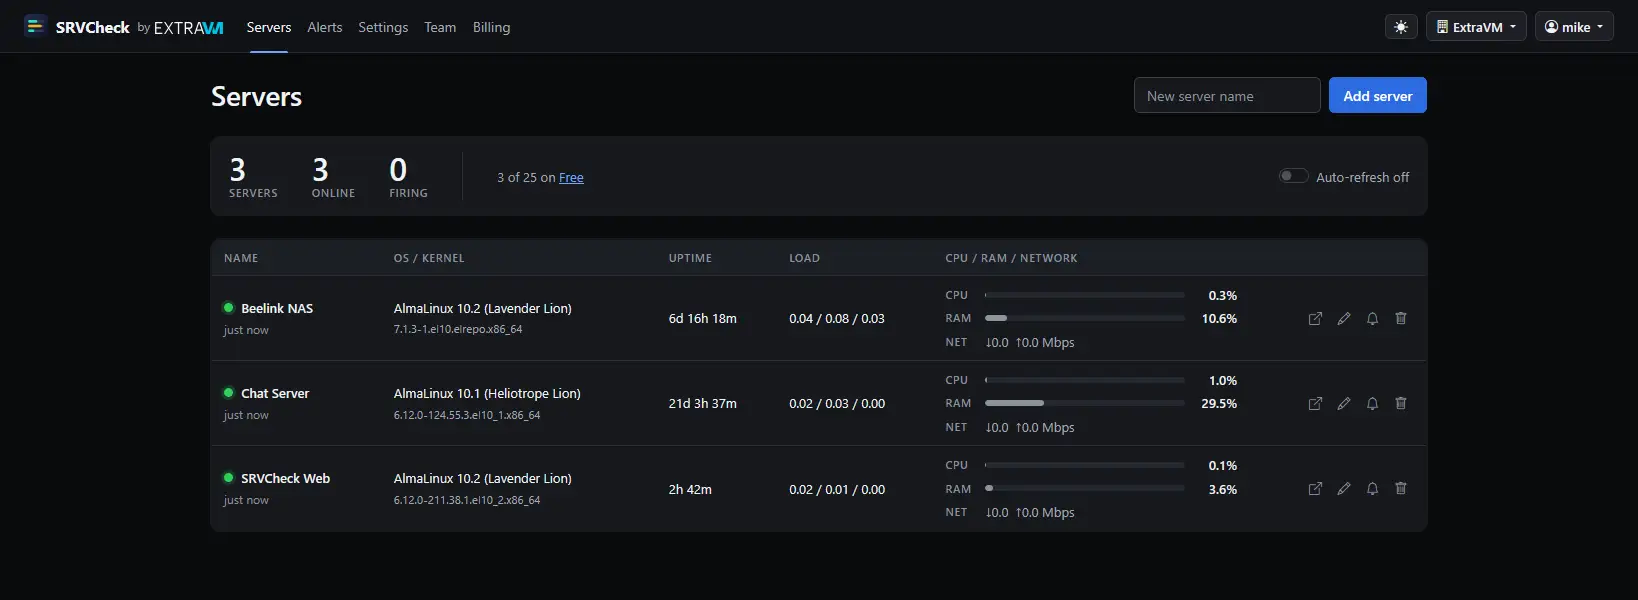
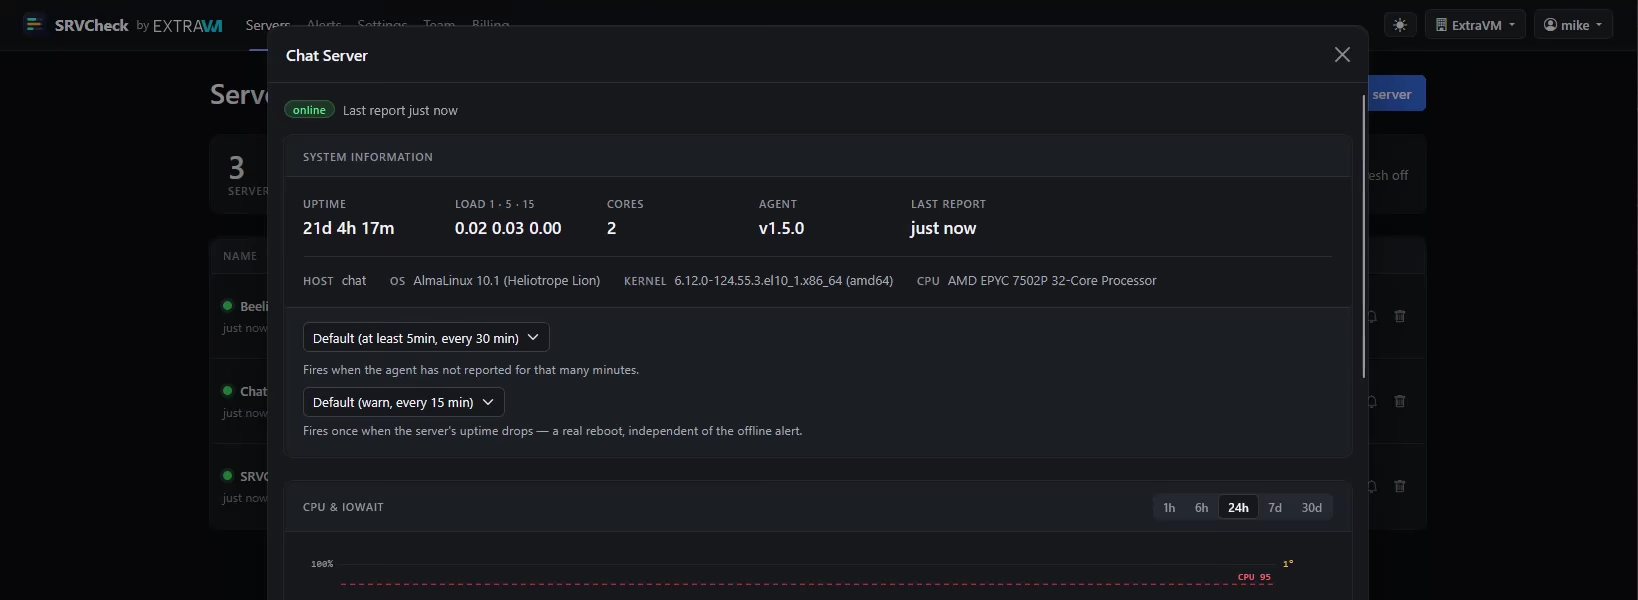
View of the main dashboard. Mobile friendly, you can add to your home mobile device screen. There's pages to check past alerts, manage your org/acc, manage alerting channels, etc.
Comments
Just about two hours ago, I was looking at your website and noticed a link to something called “smokegraph” that I hadn't seen before, and it reminded me of Smokeping, a tool I often use. After looking at the graphs, I started wondering if you were using any open-source tools for that monitoring system that tracks packet loss.
Does this new service perform that kind of monitoring? Or is Smokegraph some kind of internal tool you guys use?
Backend Ruby Dev and Linux user
no, I just made that with Claude. I used Smokeping in the past and some other similar software but never liked them, and I wanted a more simple/user-friendly way add probes and to try to see latency issues to some niche networks. Honestly it never was going to be public really but I wanted a easy way for some clients to be able to bring it up easily to check on their end, which is why it's just a link in the footer and nothing else. It also just uses a small Go agent to run tests and report back to the web server script to store in a SQL database. If you want a copy of that PM me and I'll send you a zip after I remove some of my stuff from it.
The SRVCheck stuff doesn't do any latency/packet loss checks, and it's not really made for it since it just reports to a centralized server, and doesn't have remote probes to check systems. The smokeping type script you're talking about has a bunch of probes deployed on my looking glass servers.
ExtraVM - KVM NVMe VPS in USA, EU, APAC -|- RackColo - Find Colo
can i use my extravm login details to use srvcheck or do i need new username and password?
no, everything is completely separate.
--
I added a few additional things;
ExtraVM - KVM NVMe VPS in USA, EU, APAC -|- RackColo - Find Colo
Not bad, I am seeing ~11MB avg, 13.7MB peak on a Storage VPS. After about 24 hours of running it.
Is there some way to confirm the push frequency if so desired, like once every 2 minutes or 5 minutes? I see the alerting is configurable, but I didn't see the reporting.
Pulsed Media: The Eternal Väinämöinen Sale: Seedboxes and storage boxes from €1.99/mo, priced for life. (ref/aff link)
You can edit the /etc/sysmon-agent/agent.conf on the server:
INTERVAL=60sThe default interval is based on the plan settings (60s for these for now), so just change it to 300s for 5 minutes and restart the sysmon-agent service. But really having a lower interval doesn't cause any extra resource use.
If you're referring to something else let me know.
Edit - If you're asking about it due to the system log entries for the agent push, I will add a config setting to disable logging the push output.
Edit 2 - Update agent and add LOG_PUSH=0 and restart to avoid logging now. It's disabled by default now.
ExtraVM - KVM NVMe VPS in USA, EU, APAC -|- RackColo - Find Colo
Yeah, I meant configure, not confirm, sorry. Yes, that should do it.
I was wanting to run this on a few test servers where I don't need 1m monitoring for me every couple minutes is fine.
Reducing non-error logging (or adding logging levels to the conf) would be nice.
Pulsed Media: The Eternal Väinämöinen Sale: Seedboxes and storage boxes from €1.99/mo, priced for life. (ref/aff link)
Pretty neat UI/UX, looks quite well made for sure
Curious/Off-Topic: Per-Server/Device, how much data (say in MB or GB) is it for 90 days of graphs?
CrownCloud - Internet Services | Los Angeles, California | Frankfurt, Germany | Amsterdam, The Netherlands | Atlanta, Georgia | Miami, Florida
This is something I'd like to know as well lol. Since this version is new I don't have data for more than a week or so. But it's probably very small, data after 24 hours is compacted into 5 minute intervals (tldr big storage reduction percentage) so it doesn't store every single data point in the database when the older historical chart data can't be searched in the first place. Since it was originally made for my own use that's how I wanted it since it's meant more to find recent issues based on resource use, not historical ones (besides the main point just being active alerting for resource thresholds.)
I am using it for the primary resource monitoring and alerting for all of ExtraVM's stuff now, finished moving everything off of my original one day or two ago. The public one is fancier and has some bugs fixed that my original one didn't. Also I didn't check my old data before killing it, but I was also running a lower interval that stored more data anyway.
I will probably keep the current 25 server limit for free/public use.
@SpeedBus Btw, your public knowledge base is great. I've used it in the past a long time ago and it was a good resource for some specific things (at least before AI gobbled it all up.) Just want to appreciate the time you guys put into it.
ExtraVM - KVM NVMe VPS in USA, EU, APAC -|- RackColo - Find Colo
aha nice this makes more sense, merging in the older data into 5 min timeframe is way better, a while ago I was logging ping requests from 5 locations on a per minute basis and it quickly went crazy haha, and yeah, fair point too, the more recent data is more valuable to debug stuff out and the 1 or 5 minute timeframe should be good enough to get a idea too either way.
oh for sure, I couldn't believe its bootstrap based for the UI, looks fresh/crisp.
hehe thank you glad to know it was of help, and yeah.. AI certainly has taken away the appeal of the wiki even personally I end up querying claude far more than before, but we try to keep the wiki updated with the basic stuff whenever a new operating system comes out at least
CrownCloud - Internet Services | Los Angeles, California | Frankfurt, Germany | Amsterdam, The Netherlands | Atlanta, Georgia | Miami, Florida
I like that webhooks are free. I'll set one of the nonprofits I'm webmastering on it.
Great! Any features added (like webhooks) won't be restricted in any way.
ExtraVM - KVM NVMe VPS in USA, EU, APAC -|- RackColo - Find Colo
Is all in one data store or is it per customer or per storage some level of storage?
Also, Not sure if I am doing something wrong here or what, but I couldn't seem to upgrade the sysmon-agent on 2 different servers. (both Debian 13)
Tried to do an upgrade from v1.6.0 to v1.8.0 is failing. (error shown below)
On another client running v1.7.0 and trying go to v1.8.0.
I got prompted for my password to run the commands, granted it, but still didn't take. The v1.6.0 I ended up just uninstalling and re-installing. This was a couple days ago, but I on v1.7.0, I think I started the systemd service and it worked. Sorry I don't have better info here, it was late and I was just trying to get it updated.
Pulsed Media: The Eternal Väinämöinen Sale: Seedboxes and storage boxes from €1.99/mo, priced for life. (ref/aff link)
Weird, a change was made with how it updates but I haven't experienced any problem. I guess it's just something permission specific with certain OS, which OS/version is was it?
no, data is stored in postgres, each data type is each in its own table associated with a the server ID. nothing special.
ExtraVM - KVM NVMe VPS in USA, EU, APAC -|- RackColo - Find Colo
@Wonder_Woman It's fixed. I manually increased all of the existing orgs yesterday or something and then updates the actual plans which doesn't override the manual limits.. and forgot.
ExtraVM - KVM NVMe VPS in USA, EU, APAC -|- RackColo - Find Colo
Debian 13.6, nothing special.
Pulsed Media: The Eternal Väinämöinen Sale: Seedboxes and storage boxes from €1.99/mo, priced for life. (ref/aff link)